

The stock market has crashed before. It will crash again. And every single time it has, investors who stayed the course — or better yet, bought more — came out ahead. That is not optimism talking; that is 100 years of documented history. Since 1900, the US stock market has endured more than a dozen major crashes, two world wars, a Great Depression, multiple recessions, a global pandemic, and a financial crisis that nearly brought down the entire banking system. Yet the Dow Jones Industrial Average has risen from roughly 66 points in 1900 to over 40,000 today. Understanding why markets crash, how deep each drop went, and what happened next is arguably the most valuable education any retail investor can receive. Panic is expensive. Perspective is priceless.
The Panic of 1907: The Crash That Built the Fed
Long before modern financial infrastructure existed, the US economy ran on trust and liquidity — both of which evaporated in October 1907. A failed attempt to corner the copper market triggered a chain reaction of bank runs across New York City. The Dow fell roughly 48% from peak to trough over about a year.
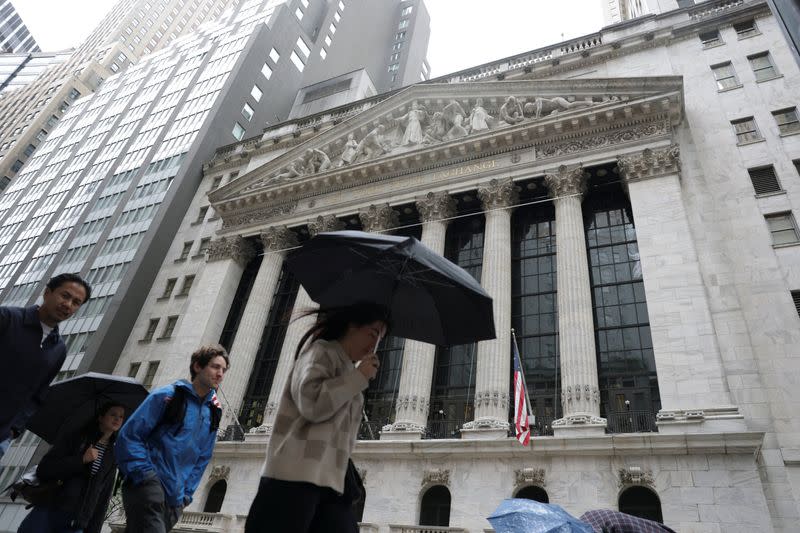
What followed was arguably more important than the crash itself. The panic exposed how fragile a banking system without a central lender of last resort truly was. J.P. Morgan personally organized a private bailout, corralling wealthy bankers to inject liquidity into failing trusts. The episode was so alarming to policymakers that it directly led to the creation of the Federal Reserve in 1913. The market recovered fully within a few years, and the institutional framework built in response made future crises more manageable — at least in theory.
The Great Crash of 1929 and the Great Depression
No crash in American history looms larger than 1929. After a roaring bull market fueled by rampant speculation and excessive margin lending, the market peaked in September 1929. By July 1932, the Dow had fallen an almost incomprehensible 89% from its peak. It would not return to its 1929 highs until 1954 — a full 25 years later.
The causes were layered: over-leveraged investors, weak bank regulation, the Federal Reserve tightening monetary policy at exactly the wrong moment, and the Smoot-Hawley Tariff Act of 1930 which choked global trade. The Depression that followed saw unemployment reach 25%.

What followed — eventually — was transformative. The New Deal reshaped the relationship between government and the economy. The Securities Exchange Act of 1934 created the SEC, bringing regulation and transparency to markets. The FDIC was established to insure bank deposits. These structural reforms made the financial system significantly more resilient. Investors who bought at the absolute bottom in 1932 and held for a decade saw extraordinary gains, though few had the stomach or capital to do so.
The Post-War Corrections: 1946, 1962, and 1966
The decades following World War II were broadly prosperous, but not without turbulence. Three notable corrections stand out:
- 1946: A post-war adjustment saw the Dow fall roughly 24% as the economy transitioned from wartime production. Recovery came within two years.
- 1962 (Flash Crash of the Kennedy Era): A sharp selloff driven by Cold War tensions and overvalued growth stocks sent the market down about 28%. President Kennedy’s confrontation with steel companies over pricing also rattled investor confidence. The market recovered within a year.
- 1966: Rising inflation and Federal Reserve tightening caused a roughly 22% decline. This foreshadowed the more painful stagflation era to come.
Each of these episodes reinforced a consistent pattern: corrections in the 20-30% range, while painful, tend to resolve within 12-24 months when the underlying economy remains functional.
The 1973–1974 Bear Market: Stagflation Strikes
The oil embargo of 1973, combined with Nixon’s removal of the dollar from the gold standard and rampant inflation, created a toxic cocktail for equities. The S&P 500 fell approximately 48% from peak to trough over roughly 21 months. This was not a short, sharp shock — it was a grinding, demoralizing decline that tested even the most patient investors.
The recovery was slow but real. By 1976, the market had reclaimed its losses. More importantly, this era gave birth to some of the greatest investment fortunes in history. Warren Buffett, who had closed his partnership in 1969 citing overvalued markets, began aggressively buying beaten-down companies during this period. The lesson: prolonged bear markets create generational buying opportunities for those with cash and conviction.
Black Monday — October 19, 1987
October 19, 1987 remains the single worst one-day percentage decline in US stock market history. The Dow Jones fell 22.6% in a single session — a number so staggering it still defies easy explanation. Contributing factors included program trading (early algorithmic strategies), portfolio insurance strategies that amplified selling, and a rising interest rate environment.
What makes 1987 remarkable from an investor’s perspective is what happened next: almost nothing bad. The US economy did not enter a recession. Corporate earnings remained solid. The Federal Reserve, under Alan Greenspan, moved quickly to inject liquidity and reassure markets. By August 1989 — less than two years later — the Dow had fully recovered and was setting new highs.
Black Monday is perhaps the clearest historical proof that a dramatic single-day crash does not necessarily signal economic catastrophe. Investors who sold on October 20th locked in devastating losses. Those who held — or bought — were made whole relatively quickly.
The Dot-Com Bust: 2000–2002
The late 1990s produced one of the most spectacular speculative bubbles in market history. Internet companies with no revenue, no profits, and sometimes no coherent business model commanded billion-dollar valuations. The NASDAQ Composite — heavily weighted toward technology — rose over 400% between 1995 and its March 2000 peak.
The collapse was brutal. The NASDAQ fell approximately 78% from peak to trough by October 2002. The S&P 500 declined about 49%. Trillions of dollars in market capitalization evaporated. Many individual dot-com stocks went to zero.
Yet the story has a crucial nuance. The underlying technology that drove the bubble — the internet — was real and transformative. Companies like Amazon and Apple, which survived the bust, went on to become the most valuable businesses in human history. The S&P 500 recovered its 2000 peak by 2007. The NASDAQ did not fully recover until 2015, a sobering reminder that index composition matters enormously, and that buying broad diversification is safer than chasing hot sectors.
The 2008–2009 Financial Crisis: The System Itself Nearly Failed
The Global Financial Crisis was different in character from most previous crashes. This was not a valuation bubble or an external shock — it was a near-collapse of the global banking system, triggered by a housing bubble inflated by reckless mortgage lending, complex securitization, and catastrophically mispriced risk.
The S&P 500 fell approximately 57% from its October 2007 peak to its March 2009 trough. Major financial institutions — Lehman Brothers, Bear Stearns, Washington Mutual — failed or were absorbed in emergency deals. The US government deployed hundreds of billions in bailout funds through TARP. The Federal Reserve cut rates to near zero and launched unprecedented quantitative easing programs.
What followed was the longest bull market in US history. From the March 2009 low to the February 2020 peak, the S&P 500 rose approximately 530%. Investors who bought an S&P 500 index fund at the absolute bottom in March 2009 and held for a decade more than quintupled their money. The crisis also produced the Dodd-Frank Act, which imposed stricter capital requirements on banks and created the Consumer Financial Protection Bureau.
The COVID-19 Crash: The Fastest Bear Market Ever
In February and March 2020, the S&P 500 fell approximately 34% in just 33 days — the fastest bear market decline in history. The cause was unprecedented: a global pandemic that shut down entire economies virtually overnight.
The recovery was equally unprecedented. Massive fiscal stimulus (multiple rounds of direct payments, PPP loans, enhanced unemployment benefits) combined with the Federal Reserve slashing rates to zero and restarting quantitative easing produced a V-shaped recovery. By August 2020 — just five months after the low — the S&P 500 had fully recovered. By the end of 2020, it was up roughly 16% for the year.
The COVID crash reinforced several lessons: government and central bank response capacity has grown enormously since 1929; panic selling at the bottom is extraordinarily costly; and diversified index fund investors who did nothing came out fine.
The 2022 Bear Market: Inflation’s Return
After the post-COVID euphoria, 2022 delivered a painful reminder that valuations matter. The Federal Reserve, forced to combat inflation running above 9%, raised interest rates at the fastest pace since the 1980s. The S&P 500 fell approximately 25% for the year, while the NASDAQ declined roughly 33%. Growth stocks and speculative assets — including many cryptocurrencies — suffered far steeper losses.
This was a more conventional bear market driven by monetary tightening rather than an economic catastrophe. By the end of 2023, the S&P 500 had recovered most of its losses, and 2024 saw the index reach new all-time highs. The episode was a reminder that rising interest rates are a genuine headwind for equities, particularly high-multiple growth stocks.
Patterns Every Investor Should Know
Looking across more than a century of market crashes, several consistent patterns emerge that are genuinely actionable:
- Every crash has eventually been followed by a recovery. The US stock market has a 100% historical recovery rate from every bear market to date. That does not guarantee the future, but it is a powerful data point.
- The average bear market lasts about 9-18 months. Some are shorter (2020), some are longer (1929-1932), but the majority resolve within two years.
- The biggest single-day gains often occur during bear markets. Missing the 10 best trading days in any given decade dramatically reduces long-term returns. Staying invested matters.
- Crashes caused by financial system failures tend to be deeper and longer. The 1929 and 2008 crises, which involved banking system stress, produced the two deepest declines. External shocks (COVID, oil embargo) and valuation corrections tend to recover faster.
- Diversification across sectors and asset classes reduces drawdown severity. The NASDAQ’s 78% decline in 2000-2002 was far worse than the S&P 500’s 49% drop, illustrating the danger of concentration.
- Dollar-cost averaging through downturns builds wealth. Investors who continued contributing to 401(k)s through 2008-2009 bought shares at historic lows and benefited enormously from the subsequent bull market.
What to Watch During the Next Crash
Crashes are inevitable. The timing is unknowable. But certain indicators can help investors assess severity and duration:
- Credit markets: When corporate bond spreads widen sharply, it signals financial stress beyond equity markets. This is a more serious warning sign than stock prices alone.
- Federal Reserve response: The speed and scale of Fed intervention has been a major determinant of recovery duration since 2008. Watch for rate cuts and liquidity programs.
- Unemployment claims: A spike in weekly jobless claims signals the crash is bleeding into the real economy, potentially extending the bear market.
- Earnings revisions: If analysts are cutting forward earnings estimates aggressively, valuations may not be as cheap as falling prices suggest.
- Investor sentiment: Extreme fear readings on surveys like the AAII Sentiment Survey have historically been contrarian buy signals. When everyone is terrified, the selling is often nearly exhausted.
The Bottom Line
History does not repeat exactly, but it rhymes with remarkable consistency. Every major stock market crash in American history — from the Panic of 1907 to the COVID collapse of 2020 — has ultimately been followed by a recovery that rewarded patient, disciplined investors. The investors who suffered permanent losses were largely those who sold at the bottom, chased speculative assets without diversification, or used leverage that forced them out of positions at the worst possible moment.
The practical takeaway is straightforward: build a diversified portfolio you can hold through a 40-50% decline without being forced to sell, keep some cash available to deploy during panics, and resist the very human urge to flee when headlines are at their most terrifying. The next crash will feel different from all the previous ones — it always does. But the pattern of recovery has been remarkably durable.
What do you think? Share your take in the comments below.
This article is for informational purposes only and does not constitute financial advice. Always conduct your own research before making any investment decisions.